
Introduction to Infosys Q4 Results 2024
Infosys, a prominent name in the technology sector, recently Infosys Q4 Results 2024 is disclosed. This article delves into a comprehensive analysis of these results, comparing them with the preceding quarter and the corresponding period last year. Additionally, we will explore the dividend declaration by Infosys and provide insights into whether purchasing shares is advisable and potential target considerations.
Dividend Declaration
Let’s initiate our discussion by examining the dividend declaration by Infosys. This quarter, the company has announced a final dividend of Rs 20 along with a special dividend of Rs 8, culminating in a total dividend amount of Rs 28.
Analyzing Infosys Q4 Results 2024
Now, let’s delve into a detailed analysis of Infosys Q4 Results 2024. All monetary figures mentioned in this section are in crores, and we will primarily focus on the consolidated statement results.
Total Income: In Q4 2024, Infosys reported a total income of Rs 40,652 crore. Contrasting this with Q3 2024, where the total income stood at Rs 39,610 crore, and Q4 2023, with a total income of Rs 38,112 crore, we observe a consistent growth trajectory.Revenue from Operation: Excluding other income and solely considering revenue from operations, Q4 2024 witnessed a revenue of Rs 37,923 crore. Comparatively, the revenue was Rs 38,821 crore in the previous quarter and Rs 37,441 crore in Q4 2023.
Total Expenses: The total expenses incurred by Infosys in Q4 2024 amounted to Rs 30,412 crore. This contrasts with Rs 30,991 crore in the previous quarter and Rs 29,646 crore in Q4 2023.
Profit Before Tax: Notably, the profit before tax for Q4 2024 surged to Rs 10,240 crore, surpassing the figures of Rs 8,619 crore in the previous quarter and Rs 8,466 crore in Q4 2023.
Profit After Tax: Infosys reported a profit after tax of Rs 7,975 crore in Q4 2024, exhibiting a substantial increase from Rs 6,113 crore in the previous quarter and Rs 6,134 crore in Q4 2023.
Earnings Per Share (EPS): The EPS for Q4 2024 soared to Rs 19.25, compared to Rs 14.76 in the previous quarter and Rs 14.77 in the corresponding quarter last year.
INFY Stock Analysis
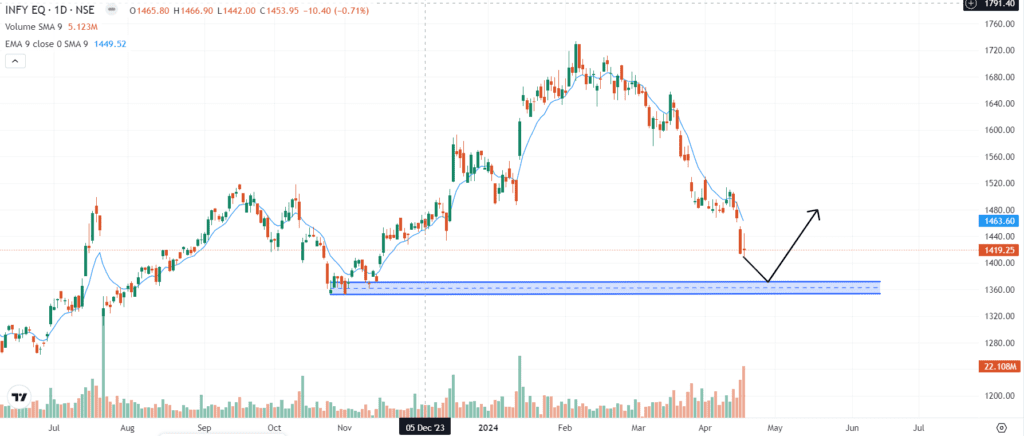
Turning our attention to INFY stock analysis, we observe that the company reached its yearly high in February 2024, touching Rs 1733. However, profit booking commenced thereafter, leading to a decline to the current level of Rs 1400.
Graph analysis indicates that the levels between 1350 to 1370 serve as significant support for INFY. Considering this, investors may consider entry into INFY within this range, with a target level of Rs 1470 for two months.
Market Insight and Strategy
Given the prevailing global market conditions, it is advisable to refrain from immediate investment at the current rate. Instead, waiting for a supportive market trend before entering the market is a prudent strategy.
In conclusion, Infosys’ Q4 2024 results demonstrate commendable performance, marked by robust financial indicators and consistent growth. With prudent investment strategies and market insights, investors can navigate the dynamic landscape of the stock market effectively.
Infosys Q4 Results 2024 Summary Table
Below is a table summarizing the key financial metrics of Infosys Q4 Results 2024, along with comparative figures from the previous quarter (Q3 2024) and the same quarter of the previous year (Q4 2023):
| Financial Metric | Q4 2024 | Q3 2024 | Q4 2023 |
|---|---|---|---|
| Total Income (in crores) | Rs 40,652 crore | Rs 39,610 crore | Rs 38,112 crore |
| Revenue from Operation | Rs 37,923 crore | Rs 38,821 crore | Rs 37,441 crore |
| Other Income | Rs 2,729 crore | Rs 789 crore | Rs 671 crore |
| Total Expenses | Rs 30,412 crore | Rs 30,991 crore | Rs 29,646 crore |
| Profit Before Tax | Rs 10,240 crore | Rs 8,619 crore | Rs 8,466 crore |
| Profit After Tax | Rs 7,975 crore | Rs 6,113 crore | Rs 6,134 crore |
| Earnings Per Share (EPS) | Rs 19.25 | Rs 14.76 | Rs 14.77 |
This table provides a clear comparison of Infosys’ performance across key financial metrics for the specified quarters, highlighting its growth and profitability trends over time.
Disclaimer: The insights and analysis presented in this content are uniquely crafted for informational purposes and do not constitute personalized financial advice. Readers are urged to conduct independent research and seek professional guidance before making investment decisions. While every effort has been made to ensure the accuracy and reliability of the information provided, no guarantee is made regarding its completeness or suitability for individual circumstances. All investment activities carry inherent risks, and readers are advised to exercise caution and diligence when navigating financial markets.


[…] Must Read: Infosys Q4 Results 2024 Analysis: Insights and Dividend Declaration […]