Nifty, Bank Nifty: Prediction for Monthly Expiry March 2024
In this article we will discuss about Nifty and Bank Nifty Monthly Expiry Levels. We will try to find the levels based on some patterns and candle chart
Nifty 50 Prediction:
Resistance Level:
Let’s start with Nifty 50 Analysis. Here in the screenshot below i have marked the resistance level for Nifty 50. Nifty 50 touched the resistance level on March 14th 2024 then it went down then again on March 22nd 2024 it came around the resistance level but failed to break.
this shows how strong the level 22200 acting as the resistance level in Nifty 50. In the next paragraph let’s discuss about the Support level of Nifty 50

Support Level:
Here in the screenshot below i have marked the support level for Nifty 50. Nifty 50 touched the support level on March 20th 2024 then it went up. Now its making a pattern which we will discuss in next paragraph

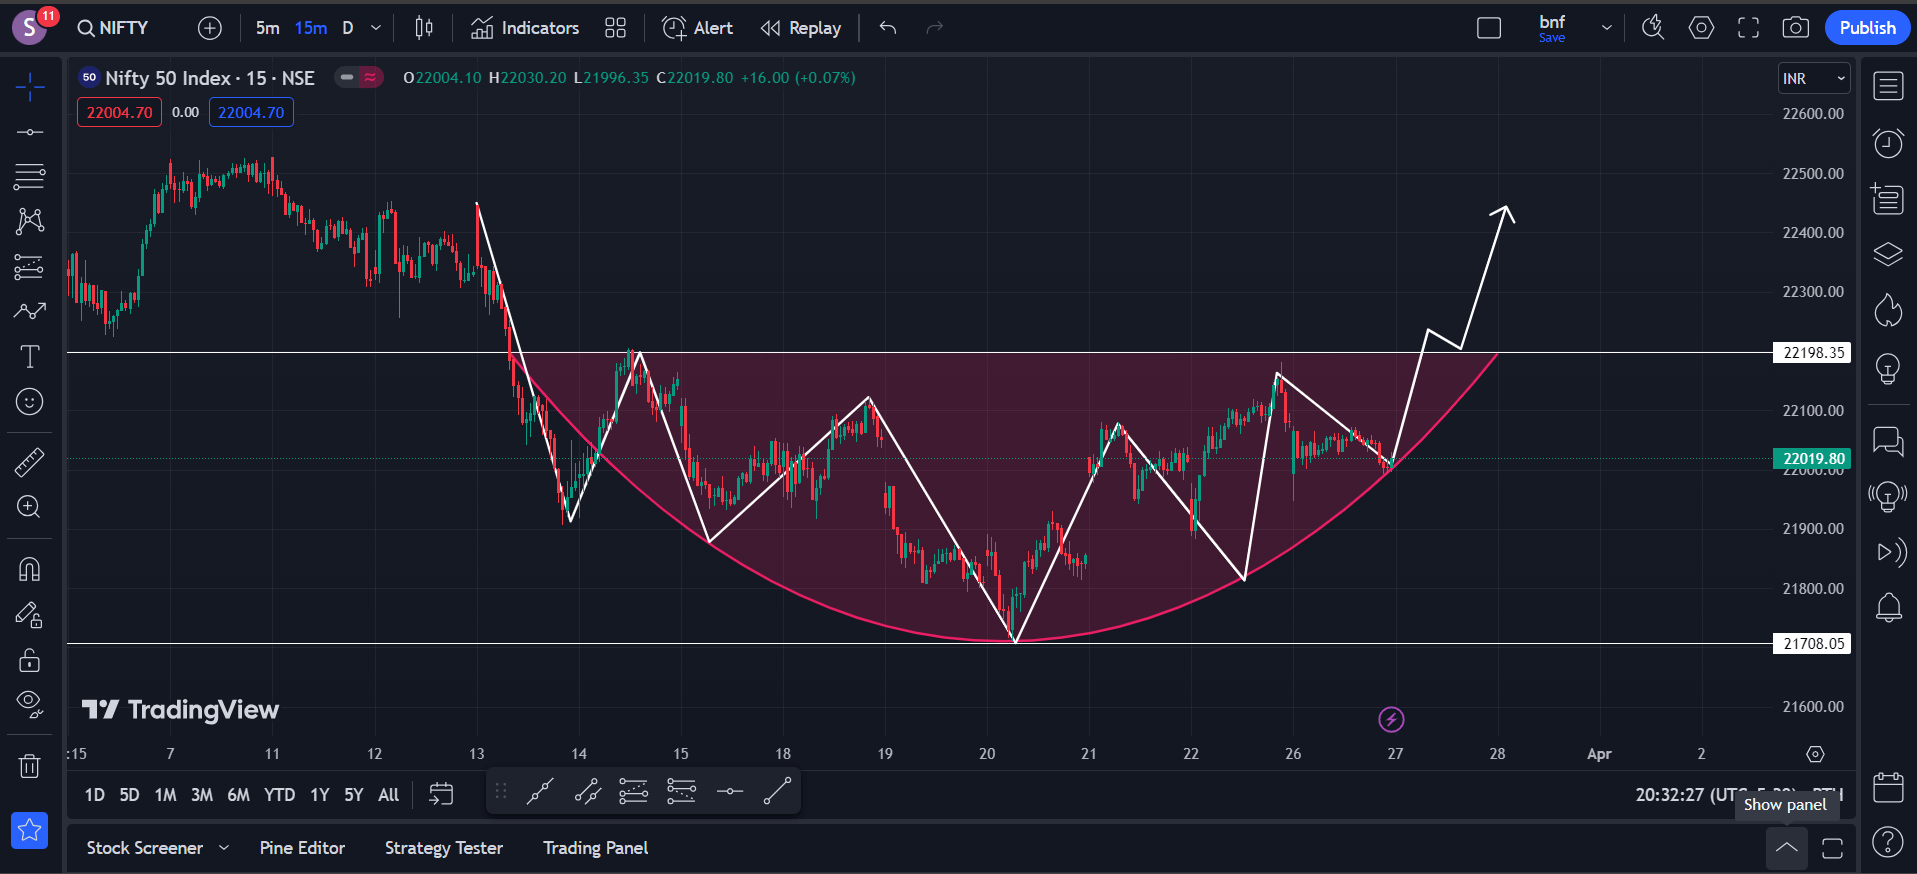
Rounding Bottom Pattern:
The rounding bottom pattern is a technical analysis pattern commonly found in financial charts, indicating a potential reversal in the direction of a downtrend to an uptrend. This pattern is formed when the price of an asset reaches a low point and then gradually begins to rise again, forming a rounded shape. Traders often look for this pattern as it can indicate a shift in market sentiment and a potential buying opportunity.
However, it’s important to note that no trading pattern is 100% reliable, so traders should use other technical indicators and risk management strategies in conjunction with the rounding bottom pattern to make informed trading decisions.
Formation: The rounding bottom pattern forms when the price of an asset gradually declines over a period of time, reaching a low point, and then begins to gradually rise again. This creates a curved or “rounding” shape on the chart.
Significance: The rounding bottom pattern suggests that selling pressure has gradually weakened, and buying interest is starting to increase. It indicates a shift from bearish sentiment to bullish sentiment in the market.
Confirmation: Traders often look for certain confirmation signals to validate the rounding bottom pattern, such as an increase in trading volume as the price starts to rise from the bottom of the curve. Additionally, a breakout above the resistance level formed by the highest point of the curve confirms the pattern.
Price Target: The price target for the rounding bottom pattern is usually measured by projecting the depth of the pattern upwards from the breakout point. This projected distance is then added to the breakout point to estimate the potential price target for the upward move.
Caution: While the rounding bottom pattern can indicate a potential trend reversal, it’s essential for traders to exercise caution and consider other factors such as overall market conditions, fundamental analysis, and additional technical indicators before making trading decisions based solely on this pattern.
In summary, the rounding bottom pattern is a bullish reversal pattern characterized by a gradual decline followed by a gradual rise, signaling a potential change in trend direction from bearish to bullish. Traders often look for confirmation signals and establish price targets to make informed trading decisions.

Target:
As shown in the above chart the target would be 22450 level.
Bank Nifty Prediction:
As you can see in the below screenshot Bank Nifty is trading by taking support of a trend line. And Bank Nifty have both the doors open to go upward or downward. Let’s checkout in the below section both the scenarios.

Triangle Chart Pattern:

Bank Nifty PUT Side Movement:
In the below chart, I’m showing all the necessary levels for the PUT side movement of Bank Nifty. There will be 2 entries and 2 targets. First entry is for scalping and 2nd is for long movement.
1st Entry: Below 46480 for scalping of 40-50 points.
2nd Entry: Below 46120 for 100-200 points.

Bank Nifty CALL Side Movement:
In the below chart, I’m showing all the necessary levels for the CALL side movement of Bank Nifty. There will be 2 entries and 2 targets. First entry is for scalping and 2nd is for long movement.
1st Entry: Above 46770 for scalping of 40-50 points.
2nd Entry: Below 47000 for 100-200 points.

Intraday stocks for 27 March 2024: Click on below image
Disclaimer: The predictions and analysis provided in this blog are for informational purposes only and should not be considered as financial advice. Investing in Nifty and Bank Nifty involves risk, and readers should conduct their own research or consult with a financial advisor before making any investment decisions. The author is not liable for any losses incurred based on the information presented.


Nice 👍
thank you